Let’s face it, if you’re reading anything on this blog chances are you have a closet server too. It might be some old hardware glued into a shoebox, or a 10 year old server that was “really good at the time”. If you’re especially lucky, it might even be reasonably new hardware in a closet that has some kind of environmental control…
That’s not how we geckos do though. Our current setup is a mini PC with two external 2.5″ drives connected via USB – the cases for which have been stuck to the top of the mini PC with double-sided tape. Sure it won’t win any beauty awards, but it’s enough to run a handful of VM’s at the nest (e.g Pi-Hole for Ad filtering, Nextcloud as a personal cloud service, and Shinobi for managing a few security cameras, among others).
Most recently however, I felt bad for my poor treatment of the hard-working bugger and decided to pamper it with a hand-made rack complete with 120mm fans on the top and bottom. This is where my curiosity and abundance of free time got the better of me. Of course I knew all the devices in the rack would benefit from proper ventilation, but by how much? True I could have simply stuck a generic IoT environment monitor in the rack with everything, but I didn’t have one on hand and wasn’t about to order one just to satisfy my curiosity. So I turned to a bit of scripting for the answer.
Collecting and Formatting the Data
I settled on three data points for determining the thermals for my closet server over the span of a week. The first data point that would need to be logged is the time that the reading was taken. The second data point would be the CPU temp, and the third would be the CPU fan speed.
Let’s collect
From the get go, the timestamp is available in Linux via the date command so that’s easy enough, but what about the temp and fan speed? Luckily there’s another utility available that can get that info for us, namely lm-sensors. So let’s jump right in and start by installing that utility:
apt-get install lm-sensors
Let’s format
So at this point we have everything we need to collect the data, our next challenge is formatting that data in a way we can use later for graphing. Confused? Try running sensors and you’ll notice the output of that command contains a whole lot more information than we need. To limit the output of sensors to the one line we need, we can use a neat utility called grep. In my case, the CPU temp reading returned by sensors looks like this:
coretemp-isa-0000
Adapter: ISA adapter
Package id 0: +68.0°C (high = +87.0°C, crit = +105.0°C)
Core 0: +68.0°C (high = +87.0°C, crit = +105.0°C)
Core 1: +67.0°C (high = +87.0°C, crit = +105.0°C)
As we can see above, this is a dual core system so the line I will want to filter using grep is the one that starts with “Package id 0:”. This is pretty easy:
sensors | grep '^Package id 0:'
Package id 0: +68.0°C (high = +87.0°C, crit = +105.0°C)
Great, so now we’ve narrowed it down to a single line, but there’s one small problem – to graph this data later we’ll need to store it as a float (e.g “68.0”). Luckily there is a system utility called cut we can use for this exact purpose:
sensors | grep '^Package id 0:' | cut -c17-20
69.0
That’s more like it. The “-c17” part of the cut command instructs the utility to throw away the first 17 characters in the line. The “20” part of the cut command instructs the utility to throw away every character after the 20th – what is left now is exactly what we want.
Putting it all together
Let’s put this all together in a script that we can run via cron at set intervals – we can start by creating a working directory for the script:
mkdir /tools
cd /tools
And then by creating the script using our text editor of choice, in my case this is nano:
nano logenv.sh
Here are the contents of the script on my system:
#!/bin/sh

# Change the Working Directory
cd /tools/

# Print Unix Timestamp
timestamp=$(date +%s)

# Display Temp for CPU
cputemp=$(sensors | grep '^Package id 0:' | cut -c17-20)

# Display System Fan RPM
fanspeed=$(sensors | grep '^fan2:' | cut -c24-28)

echo $timestamp","$cputemp","$fanspeed >> log.csv

exit 0
There’s a few things to take note of here. First, the cd command is necessary to ensure the script is executed in the correct directory when called by cron. Second, in my case I want the timestamp to be formatted as a straight integer, for this I use the +%s flag (which returns the time in seconds since 1970-01-01 00:00:00 UTC). If a different format is desired see this article for other flags that can be used with the date command. Lastly, notice that we’ll be piping the output of all the variables to a CSV file – this is because the graphing solution we’ll be using later on supports CSV files.
After saving and exiting the script, don’t forget to make it executable:
chmod +x logenv.sh
Next let’s set the script to be run by cron once every 5 minutes:
crontab -e
Add the line below, save and exit the crontab editor:
*/10 * * * * /tools/logenv.sh
That’s it, now we have data being collected, now let’s take a low at how we can graph the resulting log.
Creating a Nice Graph from the Log
So now we have a CSV formatted log, the contents of which look like this on my system:
1617713401,69.0,3426
1617714001,68.0,3426
1617714601,73.0,3658
As a recap, the first value is the unix timestamp, the second is the CPU temp in Celsius, and the third is the CPU fan speed. All that’s left is to graph everything out and see what kind of temperature difference we’ve achieved. For this I decided to use gnuplot – it’s small, cross-platform, and perhaps best of all, free.
How you go about setting up gnuplot depends on what OS you’re running. In my case, I decided to run it on Windows so installing it was as simple as downloading the installer off their web page. After installing, I added the gnuplot directory to my system PATH for easy access (there’s a how-to for that here) and then created a working directory for the graphing files. Copy the log created by our script into said working directory, and then additionally create a text file named “mygraph.gnuplot” (please note the extension). This file will tell gnuplot how to handle the data contained in our log. Open it up and add the following lines:
set datafile separator ','
This tells gnuplot that we are using commas to separate the data points in our log file.
set xdata time
set timefmt "%s"
set format x "%d - %H:%M"
These three lines do a few things. First we are telling gnuplot to visualize the timestamp data on a horizontal axis. Next we are telling it that our input time format is a unix timestamp, and finally we are telling gnuplot to display the time on the graph like so “Day – Hour:Minute”. Moving on, we will set the display size for the graph, our labels, and the log file we wish to plot the graph from. All in all, our “mygraph.gnuplot” file should look like this when we are done:
set datafile separator ','
set xdata time
set timefmt "%s"
set format x "%d - %H:%M"
set terminal wxt size 1300,600
set title "CPU Temp and Fan Speed"
set key autotitle columnhead
set ylabel "CPU Temp"
set xlabel 'Time'
set y2tics
set ytics nomirror
set y2label "Fan RPM"
plot 'C:\Your Working Directory\log.csv' using 1:2 with lines, '' using 1:4 with lines, '' using 1:3 with lines axis x1y2
Naturally, for the “plot” line you will need to specify the location of your log file. Assuming you’ve placed the log file and “mygraph.gnuplot” file in the same directory, you can simply open that folder and (on Windows) Shift+Right Click > “Open Powershell window here” and then run the following command to see your graph:
gnuplot.exe -p mygraph.gnuplot
Viola, thar she blow!
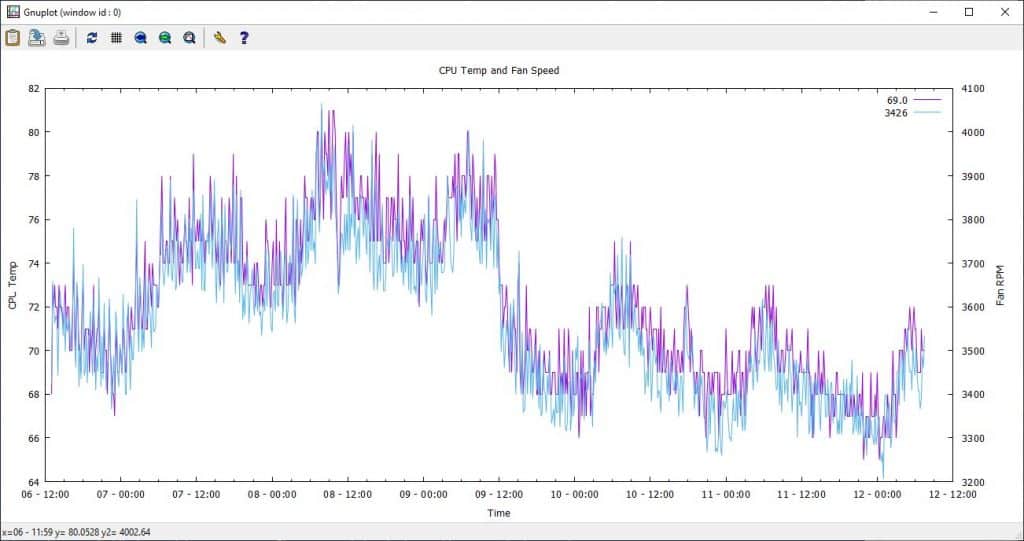
As we can see from the graph, we switched the closet server from a box to a reasonably ventilated DIY rack on the 9th at (around midnight) and our CPU temp dropped by an average of 7°C. Our CPU fan speed dropped by an average of 324RPM. Worth the rack? Absolutely. Worth the time it took to throw the script and graph together (and then write an article about it)? Maybe not, but a good exercise nonetheless.
Mandatory Plug: If this helped you, please leave me a comment. If you really want to show me some love, maybe consider downloading the Brave browser using my affiliate link – it’s a great browser that has (among other features) Ad-Block and Private Browsing over the Tor network built in. Not only that but it doesn’t send every ounce of your business to the Google overlords. 🙂